Final Assignment
Part 3
by
Allison McNeece
3. Select one additional item from the assignments or explorations that you have not written up and submit a write up
For my additional assignment I decided to do part 12 from assignment 10.
This assignment deals with cycloids, a curve I have been interested in since I read about the controversy it caused among mathematicians in the 17th century. It has been named the "helen of geometry" due to the quarrels it caused.
A cycloid is the locus of a point on a circle that rolls along a line.
See below for a GSP construction and animation of this curve.
The segment at the top is the radius of the circle. You may click on the endpoints of this segment and adjust the length to see how this effects the cycloid.
Let's now look at how we could find the parametric equations for this curve.
Starting with a circle centered at point C. Let A be a point on the circumference of circle C. A=(x,y) at time t. At time t=0 let A be at the origin (0,0).
The distance from A to C is r, the radius of the circle. If q is the angle at time t formed by r then at time t A has traveled a distance of rq on the circumference of circle C.
The distance that P has moved will be the same distance A has moved since they are traveling at a constant rate. Therefore P has also moved a distance of rq horizontally at time t.
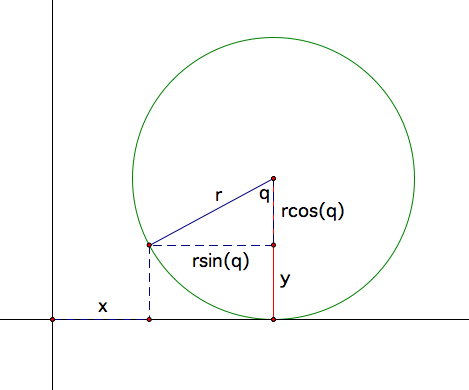
To find the x coordinate consider the figure below:
Since the center has traveled a horizontal distance of rq we have that:
x+rsin(q)=rq which means x=rq-rsin(q)
Similarly to find the y coordinate we have that :
y+rcos(q)=r which implies that y=r-rcos(q)
Since the circle is moving at a constant speed there must be a constant w such that q=wt
Thus our parametric equations for the curve of the cycloid become:
x=rwt-rsin(wt)
y=r-rcos(wt)
where r and w are constants
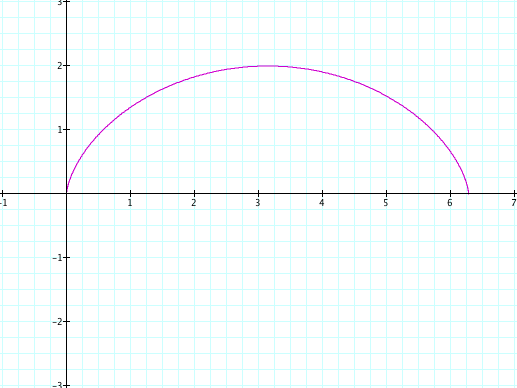
for r=1, w=1 and 0<t<2π we have the following graph:
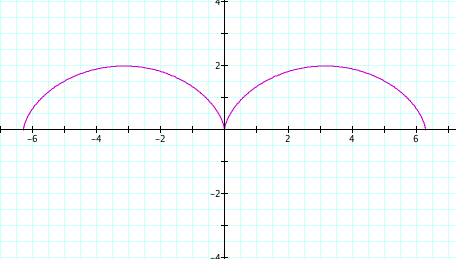
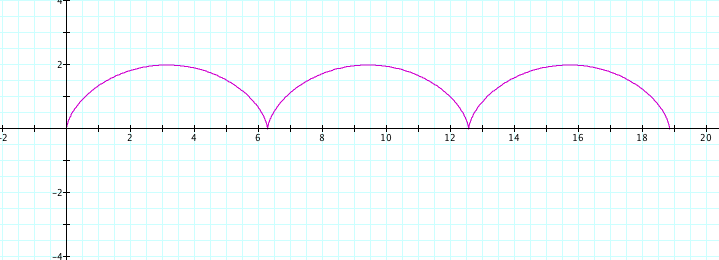
changing the range of t will give us:
-2π<t<2π
or 0<t<6π
Here is a link to the graphing calculator document for you to play with yourself